What Is Manufacturing Productivity and How to Improve It?

Time:2026-10-20 Author:Charlotte
0%

Manufacturing productivity is not simply producing more units per hour. It is the disciplined conversion of labor, materials, machines, and information into dependable customer value. In a plant, a faster line can still reduce productivity when defects, rework, waiting, or unsafe fatigue increase. A useful introduction must examine output and the hidden costs behind it. Small details matter. A missing tool, a late component, or a ten-minute changeover can quietly consume an entire shift.

Taiichi Ohno, the Toyota engineer widely recognized as a principal architect of the Toyota Production System, offered a practical warning: “Without standards, there can be no kaizen.” His statement remains relevant to how to improve productivity in manufacturing operations. Teams need visible work standards, stable measurements, and direct observation at the process. Overall equipment effectiveness, first-pass yield, cycle time, downtime, and schedule adherence provide a stronger picture than output alone. Metrics can mislead. A target may encourage shortcuts if managers ignore quality, maintenance, or employee experience.

This article explores practical improvement through bottleneck analysis, preventive maintenance, operator training, balanced workloads, and carefully tested automation. It also asks uncomfortable questions. Is the process truly inefficient, or is the data incomplete? Are supervisors solving causes, or merely chasing yesterday’s numbers? Improvements should begin with a baseline, a small experiment, and evidence from the shop floor. Not every lean initiative works. Reflection is part of productivity. Sustainable gains come from safer work, fewer defects, and processes people can repeat reliably.
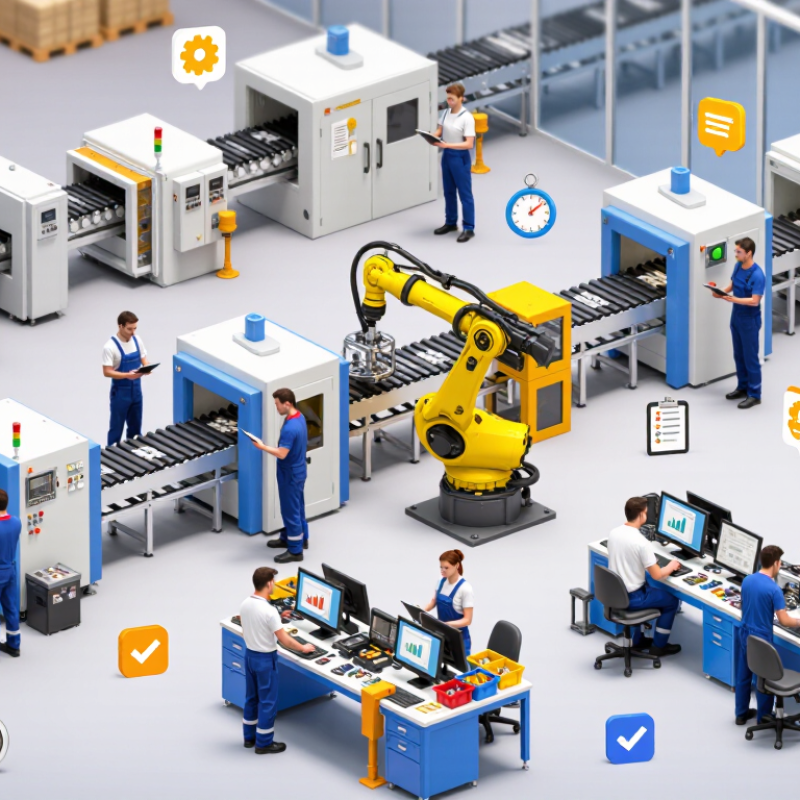
What Is Manufacturing Productivity and How to Improve It?

Defining Manufacturing Productivity and Its Core Components

Manufacturing productivity measures how effectively a factory converts resources into finished goods. These resources include labor, materials, equipment, energy, and production time. A productive operation makes more acceptable products without sacrificing safety, quality, or employee wellbeing.

Its core components are output, input, quality, and flow. Output shows the quantity produced during a defined period. Input includes working hours, machine time, raw materials, and energy consumption. Quality matters because defective units create hidden labor and material costs. Flow measures how smoothly work moves between stations. For example, a line producing 500 units may appear efficient, but frequent stoppages, long changeovers, or rework can reduce real productivity. In my experience, the most useful analysis combines production records with direct observations on the factory floor. Data can explain what happened. Operators often explain why.

Tips: Track output per labor hour, machine availability, first-pass yield, and downtime. Review these measures daily, but study weekly patterns before changing a process. A simple board near the line can reveal delays faster than a complex report. Keep definitions consistent. “Good units” should exclude products needing repair.

Improvement usually begins with a small, measurable problem. Reduce a ten-minute setup, balance an overloaded workstation, or remove repeated material searches. Standard work instructions help, but they should be reviewed when conditions change. No measurement is perfect. A dashboard may look healthy while fatigue, rushed inspections, or unstable supply quietly weaken performance. That deserves attention.

Understanding the Main Factors That Influence Production Efficiency

Manufacturing productivity means creating more usable output with the same time, labor, materials, and equipment. It is not simply faster production. Quality, energy use, safety, and delivery reliability also shape efficiency. The U.S. Bureau of Labor Statistics measures labor productivity through output per hour worked. This measure helps managers separate real improvement from longer shifts or added labor.

Several factors influence results. Machine uptime matters because small stoppages can disrupt an entire line. The International Federation of Robotics recorded 541,302 new industrial robot installations worldwide in 2023. Automation can reduce repetitive work, but poor programming may create expensive bottlenecks. Skills matter too. A well-trained operator can identify vibration, material waste, or unusual temperature before failure occurs. Energy deserves attention. The International Energy Agency reports that industry consumes about 37% of global final energy demand. A badly maintained motor quietly increases production costs. Speed alone is misleading. Quality still matters.

Tips: Track output, downtime, scrap, energy, and rework together. Review the data at shift level, not only monthly. Walk the production floor before trusting the dashboard. A common mistake is improving one machine while slowing the whole process. Test changes on a small area first. Ask operators what the numbers miss. Their answers may expose the real constraint. Efficiency plans also need revision; production conditions rarely remain stable.

Measuring Manufacturing Productivity with Reliable Performance Metrics

Manufacturing productivity measures how effectively a factory converts time, labor, materials, and equipment into saleable products. Reliable performance metrics make this relationship visible. Without consistent data, productivity reports can look precise while hiding daily production losses.

A practical measurement system should track output against planned production time, not simply total hours worked. Overall equipment effectiveness can combine availability, performance, and quality. Availability reveals downtime. Performance shows whether machines run at their designed speed. Quality counts acceptable units, not just completed units. First-pass yield, scrap rate, labor hours per unit, and changeover time add useful detail. Keep definitions stable. A rejected unit must not become “finished output” in one report and “scrap” in another.

Data quality deserves equal attention. Supervisors should compare machine records with shift logs and investigate unusual changes. A ten-minute stoppage may seem minor, but repeated across three shifts, it becomes a serious capacity loss. Visual dashboards can show trends by line, product, and shift. However, faster output is not automatically better. It may increase defects, overtime, or equipment stress. This is where metrics need judgment, not blind targets. Some reports still rely on estimates, especially during manual work. That weakness should be documented and corrected over time. Productivity improves when teams use trustworthy numbers to test causes, adjust processes, and verify whether a change actually works.

What Is Manufacturing Productivity and How to Improve It?

Measuring Manufacturing Productivity with Reliable Performance Metrics

The chart tracks manufacturing labor productivity as an index, where 2019 equals 100. Labor productivity is calculated as real manufacturing output divided by total labor hours. Improvements can be supported by reducing downtime, improving throughput, controlling defects, and increasing output without proportionally increasing labor hours.

Metric framework: labor productivity and output-per-hour measures used by national statistical agencies, including the U.S. Bureau of Labor Statistics.

Identifying Common Causes of Low Productivity on the Factory Floor

What Is Manufacturing Productivity and How to Improve It?

Identifying Common Causes of Low Productivity on the Factory Floor

Low productivity rarely begins with slow operators. It often starts with unstable processes, missing materials, or equipment waiting for maintenance. The U.S. Department of Energy reports that motor-driven systems represent a major share of industrial electricity use, so inefficient motors can quietly raise costs and reduce output. A machine may still run, but excessive vibration, heat, or repeated minor stops can signal hidden losses.

Unplanned downtime is another common cause. The International Federation of Robotics recorded 541,302 industrial robot installations worldwide in 2023, showing how factories are investing in automation. Automation alone does not solve weak workflows. Poorly trained staff may stop a line unnecessarily, while unclear work instructions create different methods for the same task. Small delays accumulate. A five-minute material search, repeated twenty times daily, becomes a serious capacity loss.

Factory managers should examine stoppage records, changeover times, scrap rates, and waiting periods together. A dashboard can look healthy while operators bypass difficult procedures. That is a warning sign, not a success. Ergonomic problems also deserve attention; the World Health Organization and International Labour Organization estimate that work-related musculoskeletal disorders affect about 1.71 billion people globally. Better tool placement, realistic targets, and preventive maintenance can improve flow. Yet measurement is imperfect. If workers fear blame, reported data may become cleaner while actual performance gets worse.

What Is Manufacturing Productivity and How to Improve It? — Identifying Common Causes of Low Productivity on the Factory Floor
Productivity Dimension Key KPI Current Factory-Floor Data Common Cause of Low Productivity Recommended Improvement Practical Target Potential Improvement
Labor efficiency Good units per labor hour 480 good units produced ÷ 120 labor hours = 4.0 units/hour Excessive walking, unclear work instructions, unbalanced workloads, and waiting for materials. Use standardized work, point-of-use material storage, line balancing, and hourly production tracking. 4.6 units/hour +15.0%
Overall equipment effectiveness OEE = Availability × Performance × Quality 82% × 88% × 97% = 70.0% OEE Frequent stops, reduced machine speed, setup losses, and defective output. Record the six major equipment losses, conduct daily loss reviews, and apply preventive maintenance. 85% availability, 92% performance, 98% quality = 76.7% OEE +6.7 percentage points
Equipment availability Planned production time available for operation Unplanned downtime represents 9.5% of planned production time Unexpected breakdowns, delayed maintenance response, and insufficient spare parts. Apply condition-based monitoring, critical-spares planning, and preventive maintenance compliance checks. Unplanned downtime at or below 5.5% 42.1% reduction
Changeover efficiency Average changeover time Average changeover takes 75 minutes Tools and materials are not prepared, machine settings vary, and adjustments are performed after shutdown. Use SMED principles, prepare external tasks in advance, standardize settings, and use quick-release fixtures. 45 minutes 40.0% reduction
First-pass quality First-pass yield 93.0% of units pass inspection without rework Process variation, incorrect machine parameters, inadequate training, and late defect detection. Use mistake-proofing, in-process checks, statistical process control, and parameter control plans. 97.0% first-pass yield +4.0 percentage points
Material utilization Scrap rate Scrap equals 4.8% of material input Incorrect cutting, handling damage, unstable processes, and inaccurate material specifications. Track scrap by cause, verify incoming material, optimize cutting parameters, and perform root-cause analysis. Scrap rate at or below 2.5% 47.9% reduction
Production flow Work-in-process inventory Average WIP equals 3.2 production days Batch production, bottlenecks, uneven cycle times, and poor production sequencing. Introduce pull signals, reduce batch sizes, balance bottleneck operations, and review the production schedule daily. 2.0 production days of WIP 37.5% reduction
Schedule reliability Schedule attainment 84.0% of planned orders are completed on time Unplanned downtime, material shortages, inaccurate capacity assumptions, and frequent priority changes. Use finite-capacity scheduling, confirm material availability, freeze near-term schedules, and escalate constraints early. 95.0% schedule attainment +11.0 percentage points
Workforce capability Standard-work training coverage 62.0% of operators have current documented training High employee turnover, informal work practices, and limited cross-training. Use skills matrices, certification checks, job instruction training, and cross-training for critical operations. 95.0% current training coverage +33.0 percentage points
Maintenance responsiveness Mean time to repair Average repair duration is 110 minutes Fault diagnosis is slow, maintenance procedures are incomplete, and tools or spare parts are unavailable. Use equipment fault codes, standard repair instructions, technician response targets, and spare-parts kitting. 75 minutes 31.8% reduction
Continuous improvement Corrective actions closed on time 68.0% of assigned actions are closed by their due date Unclear ownership, weak follow-up, and solutions that address symptoms rather than root causes. Assign accountable owners, use A3 or 5-Why analysis, review action aging weekly, and verify results with KPI data. 90.0% on-time closure +22.0 percentage points
KPI definitions: OEE combines availability, performance, and quality; first-pass yield measures units accepted without rework; schedule attainment measures completed planned output against the production schedule. The figures are generalized, non-company-specific factory-floor reference values designed for operational analysis.

Applying Practical Strategies to Improve Manufacturing Productivity

What Is Manufacturing Productivity and How to Improve It?

Manufacturing productivity measures how effectively a factory converts labor, materials, time, and equipment into quality output. A practical assessment should examine output per labor hour, equipment availability, first-pass yield, downtime, and rework. More units do not always mean better productivity. If defects increase, the factory may only be producing waste faster.

Applying practical strategies starts with a reliable baseline. Record stoppages, changeover times, scrap, and labor requirements across several shifts. Then identify the main bottleneck, rather than improving every area at once. Standard work instructions can reduce variation, especially when operators perform the same task differently. Preventive maintenance also protects productivity. A worn sensor or poorly aligned tool can create repeated delays. Small trials are useful. However, not every improvement will work as expected. Teams should review the results, question the assumptions, and adjust the process.

Tips: Hold short daily floor meetings. Use simple visual boards to show targets and actual results. Train operators on both task steps and quality checks. Keep measurements consistent. Ask why delays happen before blaming people. A faster line is not automatically a better line. Safety, product quality, and worker feedback must remain part of the productivity decision.

FAQS

What does manufacturing productivity measure?

It measures how effectively a factory turns labor, time, materials, and equipment into quality products.

Which metrics reveal equipment performance?

Track availability, speed, quality, downtime, and overall equipment effectiveness. Each metric shows a different production problem.

Why is planned production time important?

Compare output with planned operating time, not only total hours worked. This exposes hidden capacity losses.

How should factories measure quality?

Count acceptable units, first-pass yield, scrap, and rework. Completed units alone can hide defects.

What can a ten-minute stoppage really cost?

One stoppage seems small. Repeated across three shifts, it can remove significant production capacity.

How can teams improve productivity practically?

Record stoppages, changeovers, scrap, and labor needs across several shifts. Then address the main bottleneck.

Can faster production reduce productivity?

Yes. Higher speed may create defects, overtime, waste, or equipment stress. More units are not always better.

How can factories improve data reliability?

Compare machine records with shift logs and investigate unusual changes. Some manual estimates may remain imperfect.

Why do standard work instructions matter?

They reduce variation when operators perform the same task differently. Clear steps also support consistent quality checks.

What should teams review after an improvement trial?

Compare actual results with the baseline. Question assumptions, verify the change, and adjust the process when needed.

Conclusion

Manufacturing productivity measures how effectively a factory transforms labor, materials, equipment, and time into quality products. Its core components include output, resource utilization, production speed, quality, and consistency. To understand performance accurately, manufacturers should track reliable metrics such as output per labor hour, overall equipment effectiveness, cycle time, downtime, defect rates, and on-time completion. These indicators reveal whether resources are being used efficiently and where improvements are needed.

Low productivity often results from unplanned equipment stoppages, inefficient workflows, material shortages, poor communication, inconsistent training, and excessive waste or rework. Learning how to improve productivity in manufacturing operations requires a practical, data-driven approach. Businesses can streamline processes, balance workloads, maintain equipment proactively, improve workplace organization, train employees continuously, and use real-time performance data to identify delays. By combining clear goals with regular evaluation and employee involvement, factories can increase output, control costs, improve quality, and build a more reliable production system.

Charlotte

Charlotte

Charlotte is a seasoned marketing professional with a deep understanding of the company's portfolio and a passion for elevating its presence in the market. With a keen eye for detail and a commitment to excellence, she ensures that our professional blog is regularly updated with insightful articles......